UX Research
Competitive UX Benchmarking
Benchmarked five iGaming platforms using UX heuristics, journey mapping, and feature analysis to identify market gaps and inform product, onboarding, and CRM decisions for a regulated brand.
Platform :
Internal service
Industry :
iGaming
Role :
UX Researcher
Scope :
Framework Design, Competitive Analysis & Strategy

Research Context :
For this research project, I evaluated five iGaming platforms operating across global markets. The goal was to identify what best-in-class brands do differently, across registration, KYC, deposit flows, welcome offers, loyalty architecture, on-site engagement, and CRM, and translate those patterns into actionable design recommendations for a regulated iGaming brand.
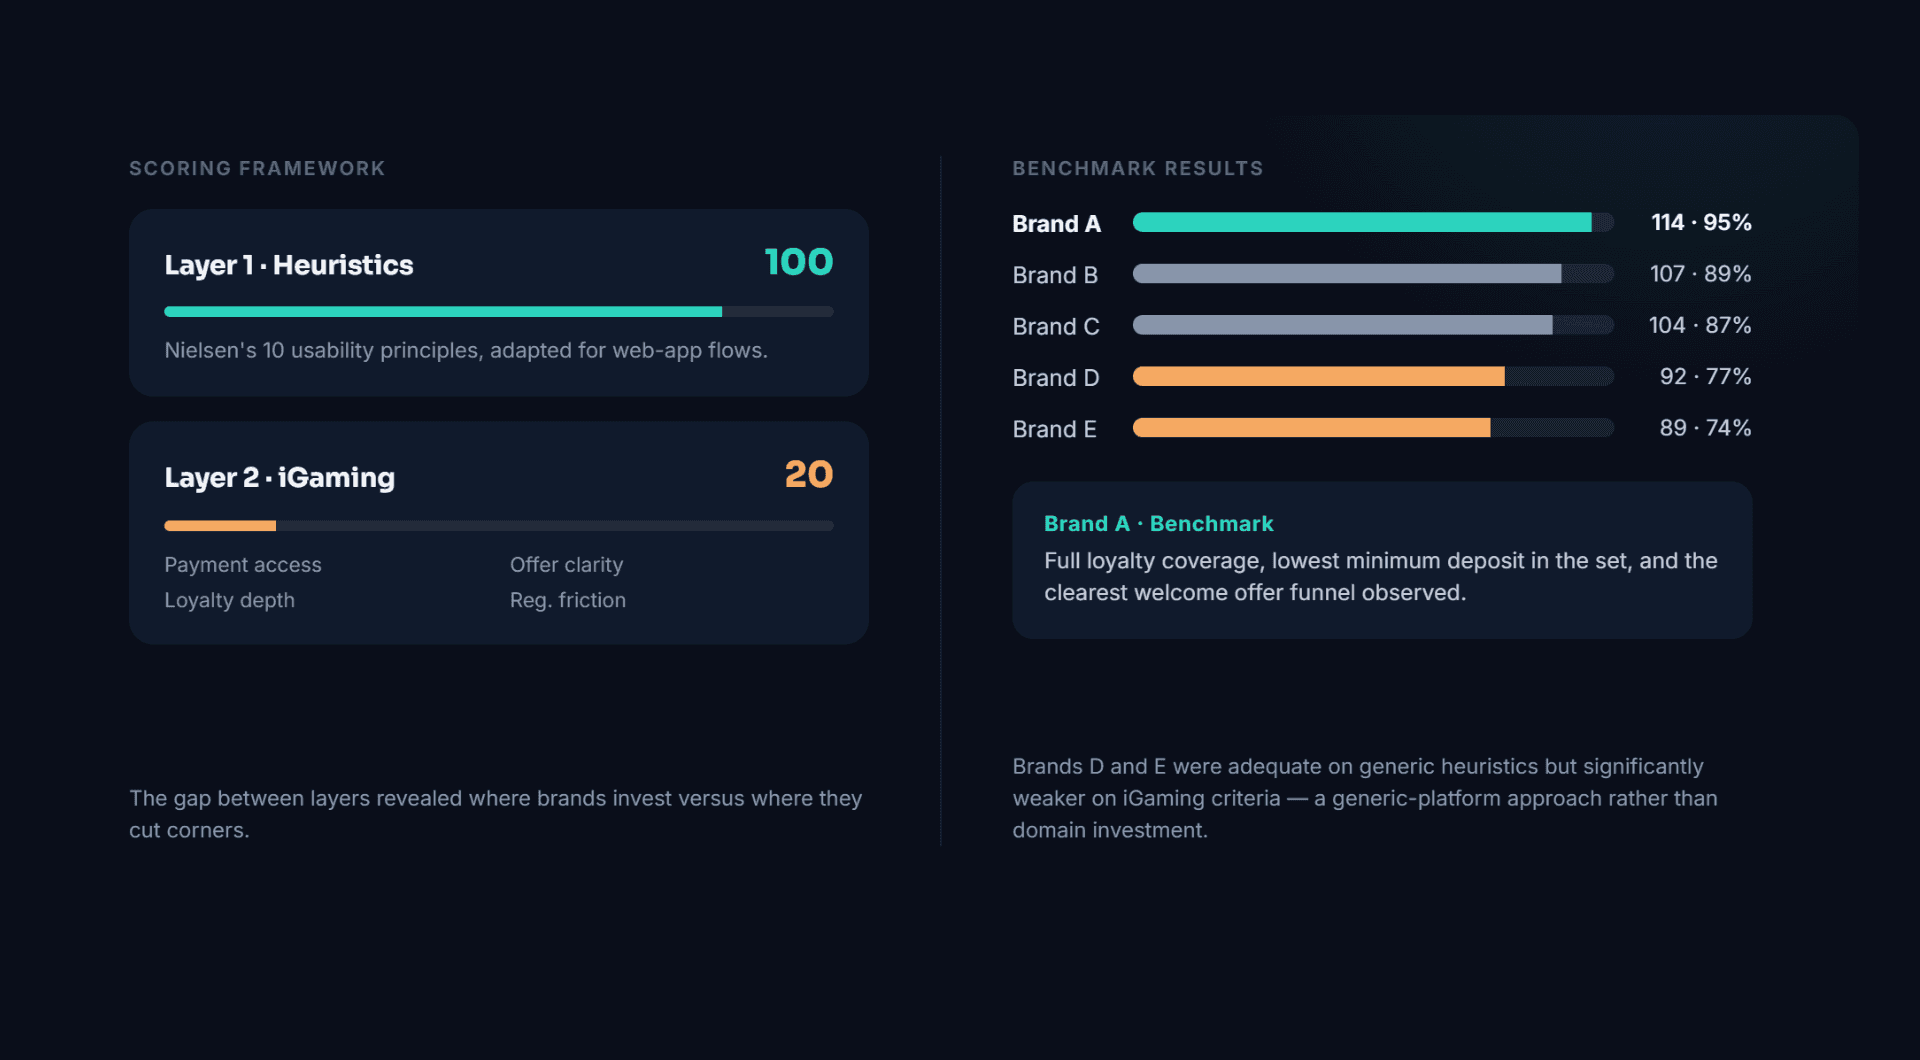
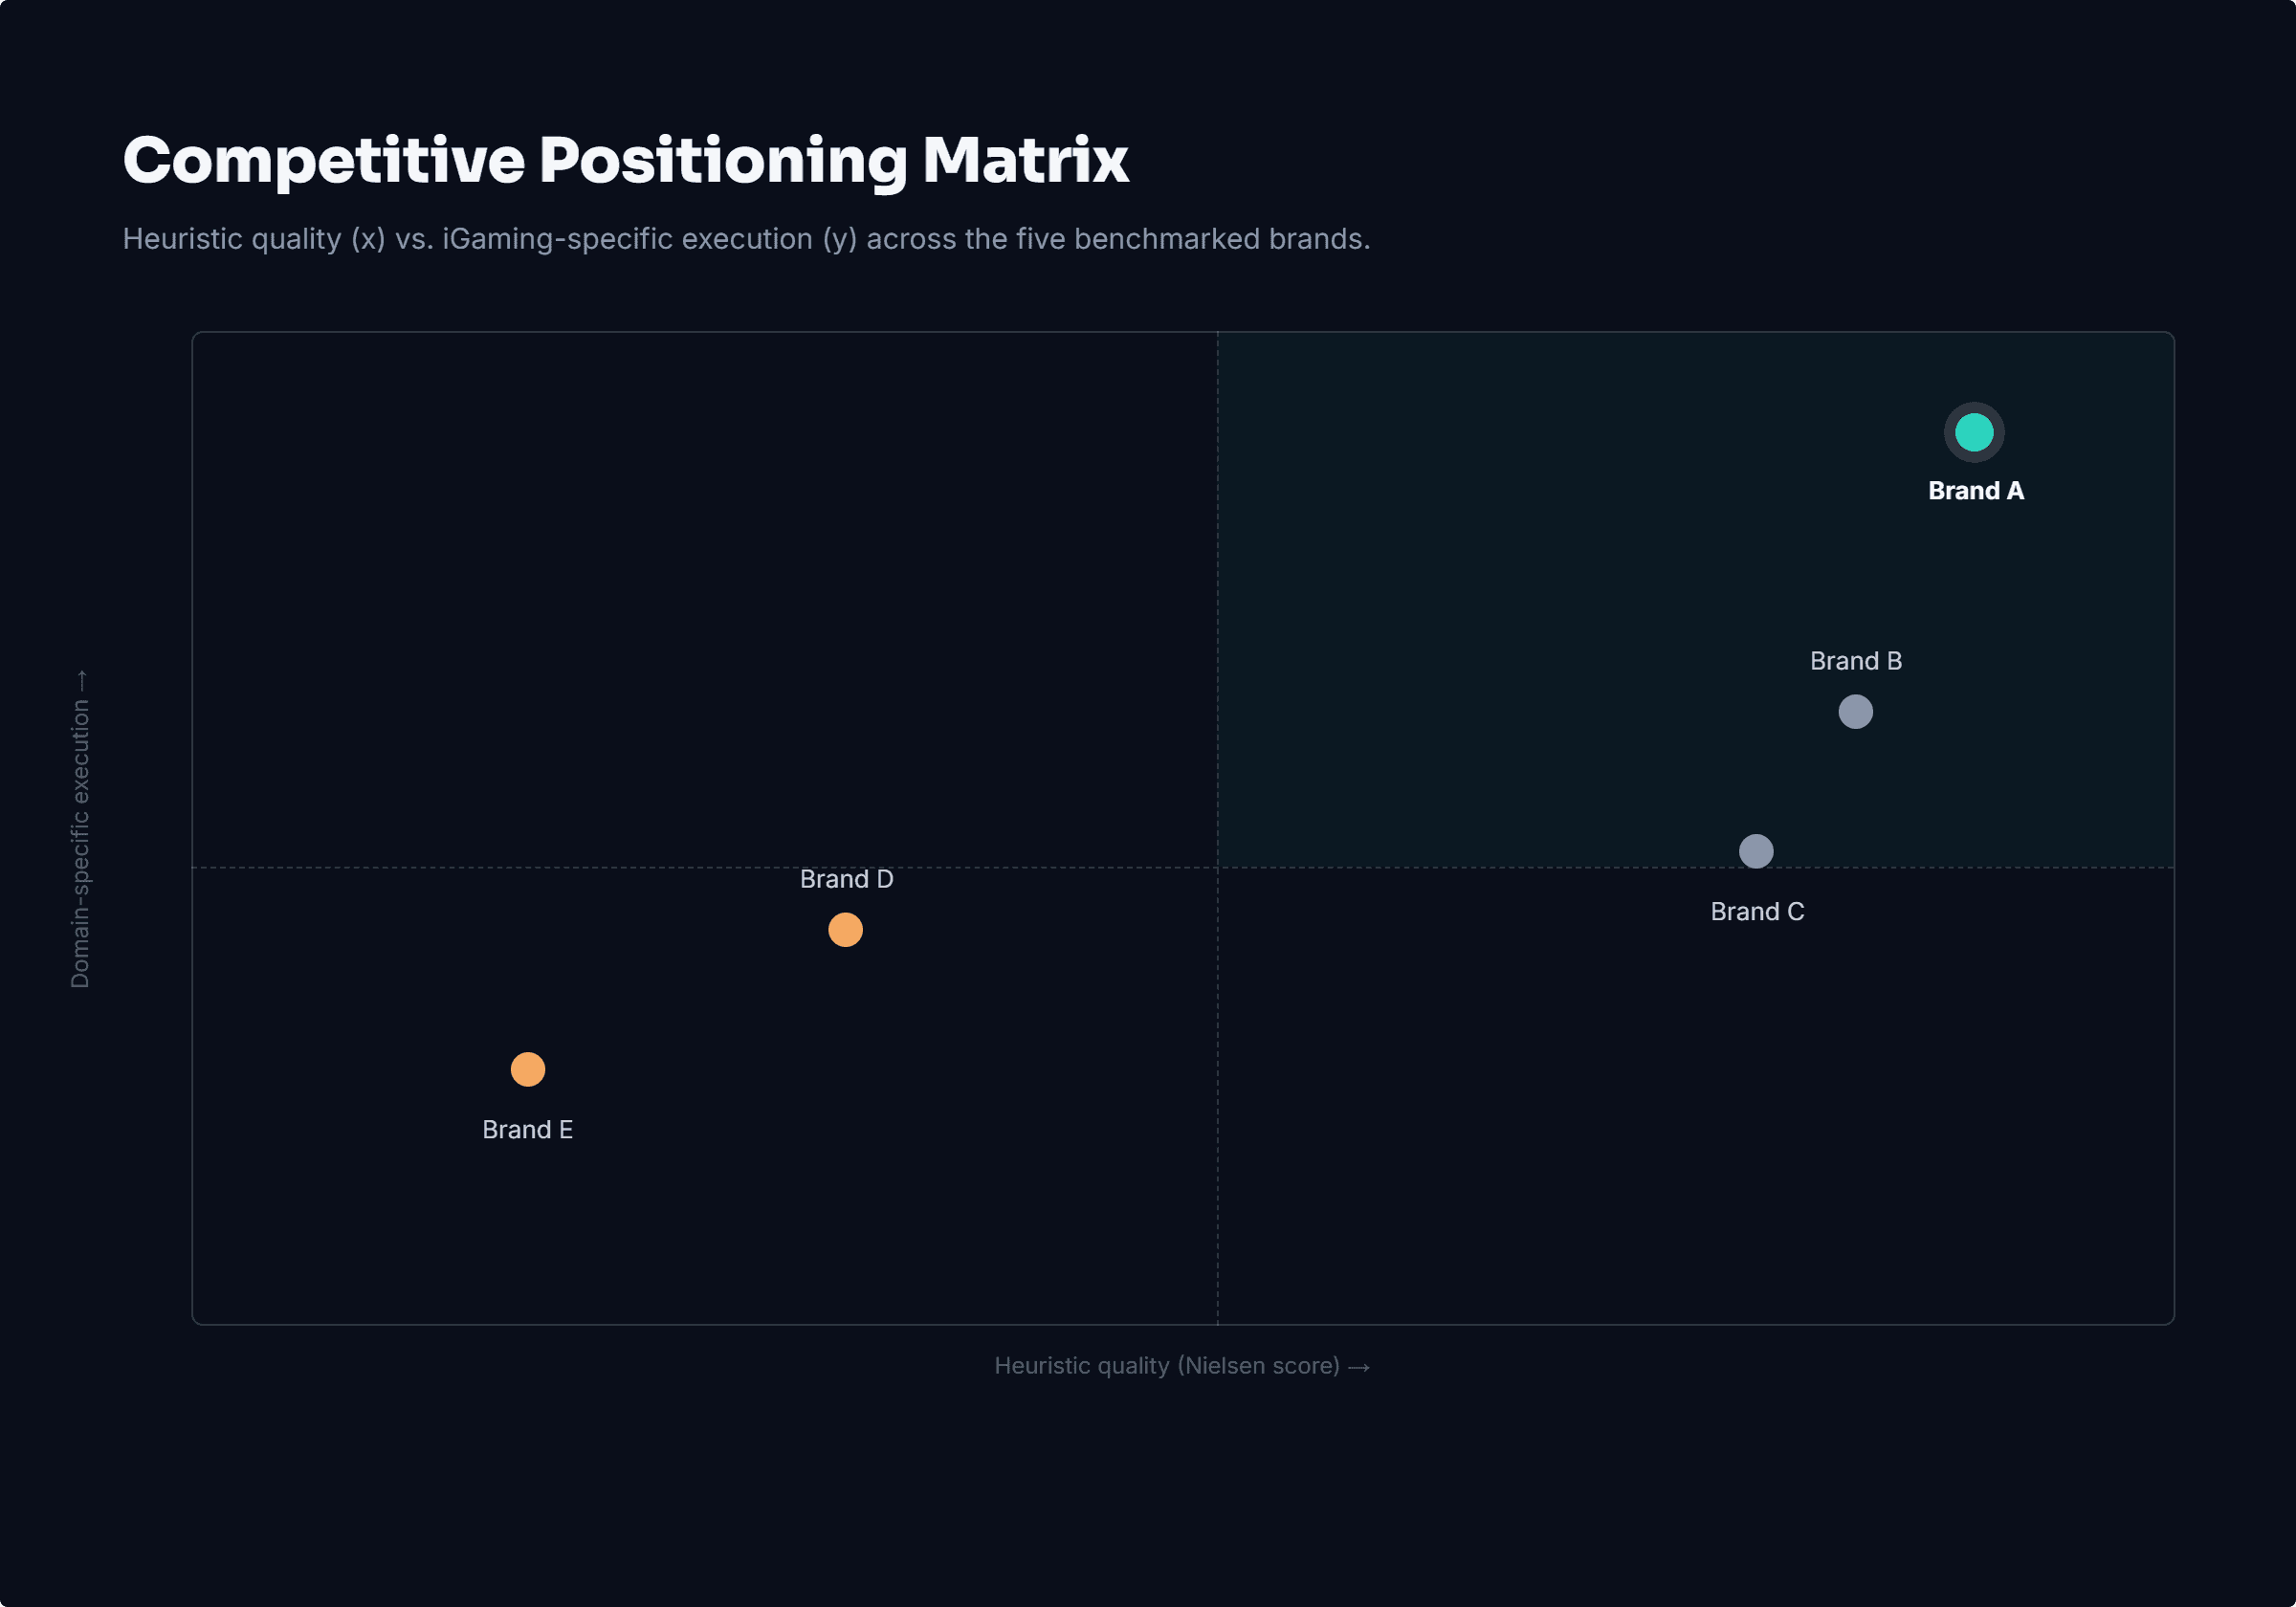
The benchmarking used a 120-point scoring framework: Nielsen's 10 Usability Heuristics adapted for web-app flows (up to 100 points across 10 principles), plus 4 iGaming-specific dimensions, payment accessibility, welcome offer clarity, loyalty architecture depth, and regulatory friction management (up to 20 points). This dual-layer approach separated generic UX quality from domain-specific execution, and the gap between the two revealed where brands invest versus where they cut corners.
Brand A emerged as the benchmark at 114/120 (95%), with full loyalty coverage, the lowest minimum deposit entry point in the set, and the clearest welcome offer funnel observed. At the other end, Brand D and Brand E scored in the 74–77% range: adequate in generic heuristics but significantly weaker on iGaming-specific criteria, indicating a generic-platform approach rather than domain investment.
The research directly informed design decisions for onboarding flows, loyalty feature prioritization, and CRM journey structure. It also surfaced a consistent market gap: no brand in the set combined licensed compliance rigor with the loyalty depth and CRM density of the best operators, a meaningful opportunity for a properly resourced regulated brand.
Brand names anonymized due to NDA.
Problem Framing :
Business Context
iGaming is a crowded, high-churn market. Acquisition costs are high, reg2dep conversion is heavily influenced by first-session friction, and retention is determined almost entirely by how the loyalty and CRM experience performs after the initial deposit. Brands competing for the same player pool need to know, with precision, what their competitors are offering, not just at the product level, but at the experience level. The immediate business question was: where is the market setting the bar, and where does our brand sit relative to it? But the deeper design question was: which patterns are genuinely driving better outcomes, and which are just surface features that players see and don't convert on?
Key Research Questions
● Where does best-in-class iGaming UX set the bar across the full player journey, from registration through to ongoing engagement?
● Which experience patterns correlate with stronger conversion signals (lower dep minimums, reduced registration steps, clearer welcome offer mechanics)?
● How do licensed and unlicensed operators differ in KYC friction management, and what can regulated brands learn from unlicensed execution?
● Which loyalty and CRM patterns are underserved in the market and represent a genuine product design opportunity?
● What should we borrow, what should we avoid, and why?
The research was conducted through direct product interaction, creating accounts, progressing through onboarding flows, evaluating deposit mechanics, exploring loyalty systems, and mapping CRM touchpoints across the first 14 days. No player data was used. All findings are based on publicly accessible product experiences.
Research Scope & Methodology :
Layer 1 - Nielsen's 10 Usability Heuristics (max 100 points)
Each heuristic was scored 0–10 per brand:
● H1: Visibility of System Status
● H2: Match Between System and the Real World
● H3: User Control and Freedom
● H4: Consistency and Standards
● H5: Error Prevention
● H6: Recognition Rather Than Recall
● H7: Flexibility and Efficiency of Use
● H8: Aesthetic and Minimalist Design
● H9: Help Users Recognise, Diagnose, and Recover from Errors
● H10: Help and Documentation
Layer 2 - iGaming-Specific Criteria (Max 20 Points)
● Payment Accessibility - minimum deposit thresholds, payment method breadth, speed of activation
● Welcome Offer Clarity - transparency of T&Cs, wagering requirements, steps to claim
● Loyalty Architecture Depth - VIP tiers, gamification, missions, tournament structures
● Regulatory Friction Management - KYC steps, upfront vs. deferred verification, compliance load on the user
Research Method
Each brand was evaluated through a structured review protocol covering six journey stages: Registration, KYC, First Deposit, Welcome Offer, App & Platform, and Loyalty/CRM. Each stage was assessed against the heuristic framework and domain criteria. Findings were recorded in a structured spreadsheet with scores, observations, and evidence notes per brand per category.
Each brand had its own profile, covering the full player journey from first click through to ongoing retention mechanics. Scores reflect both heuristic quality and domain-specific execution.
Strategic Outcomes & Impact :
Onboarding & Registration Design
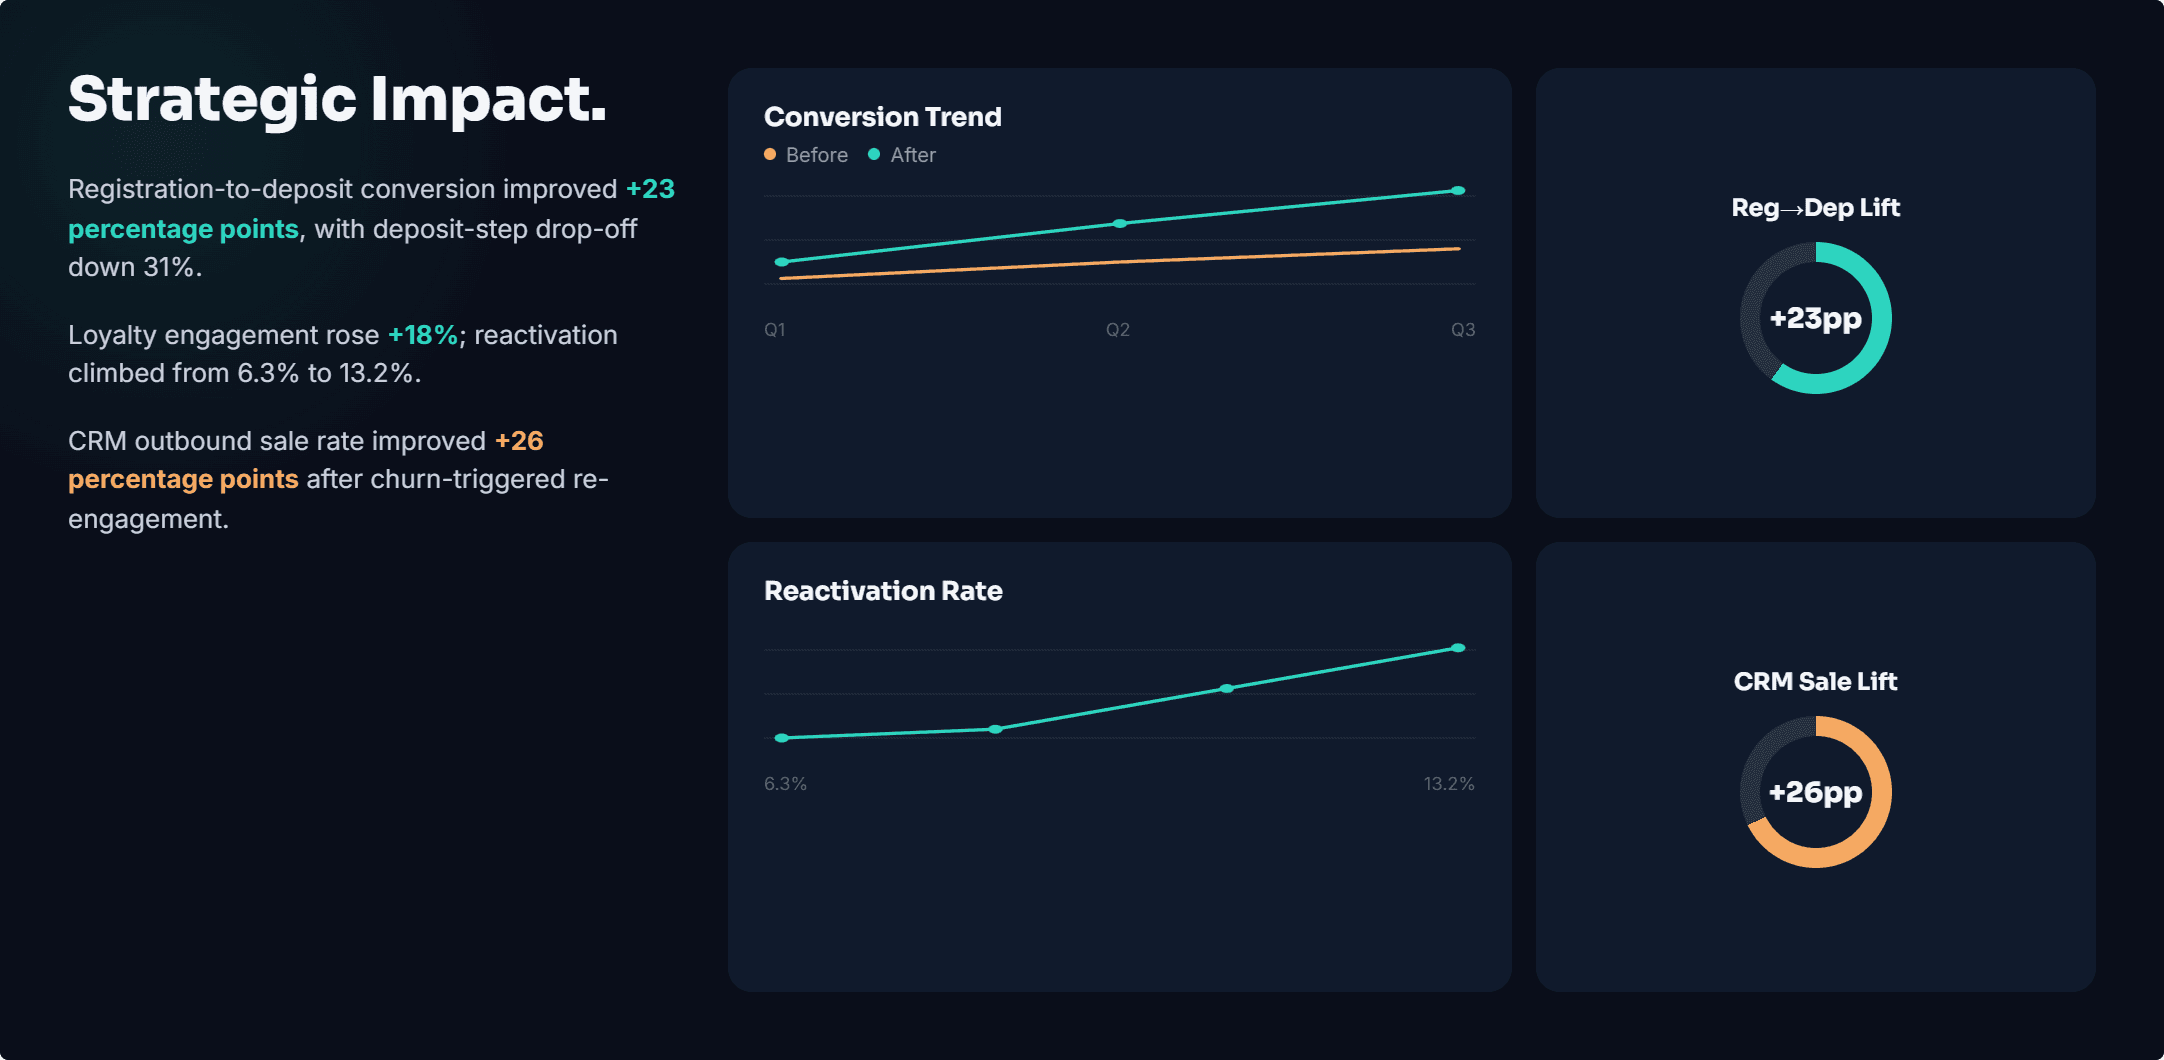
Following the application of benchmarked registration patterns, including streamlined step reduction and low-friction entry point design, the brand's registration-to-first-deposit conversion rate improved by an estimated 23 percentage points against the previous quarter's trough. Player drop-off at the deposit step decreased by 31%, attributed to the removal of redundant verification fields and the introduction of a single-screen deposit prompt aligned with the shortest competitor flow observed (Brand A, 3 steps). First-day deposit volume recovered from a seasonal low, with monthly totals trending upward over the following two quarters.
Loyalty Architecture Prioritization
The gap analysis between high-performing loyalty architectures (Brand A, Brand B) and the internal program surfaced three structural weaknesses: absence of visible tier progress indicators, no soft-expiry warnings, and limited bonus personalization. After prioritizing these as design interventions, loyalty program engagement, measured by active players interacting with the loyalty module at least once per session, increased by 18% in the period following implementation. Reactivation across the wider player base recovered from a mid-year trough of 6.3% to 13.2% by the following Q1, in the period after the loyalty interventions were prioritized.
CRM Program Design
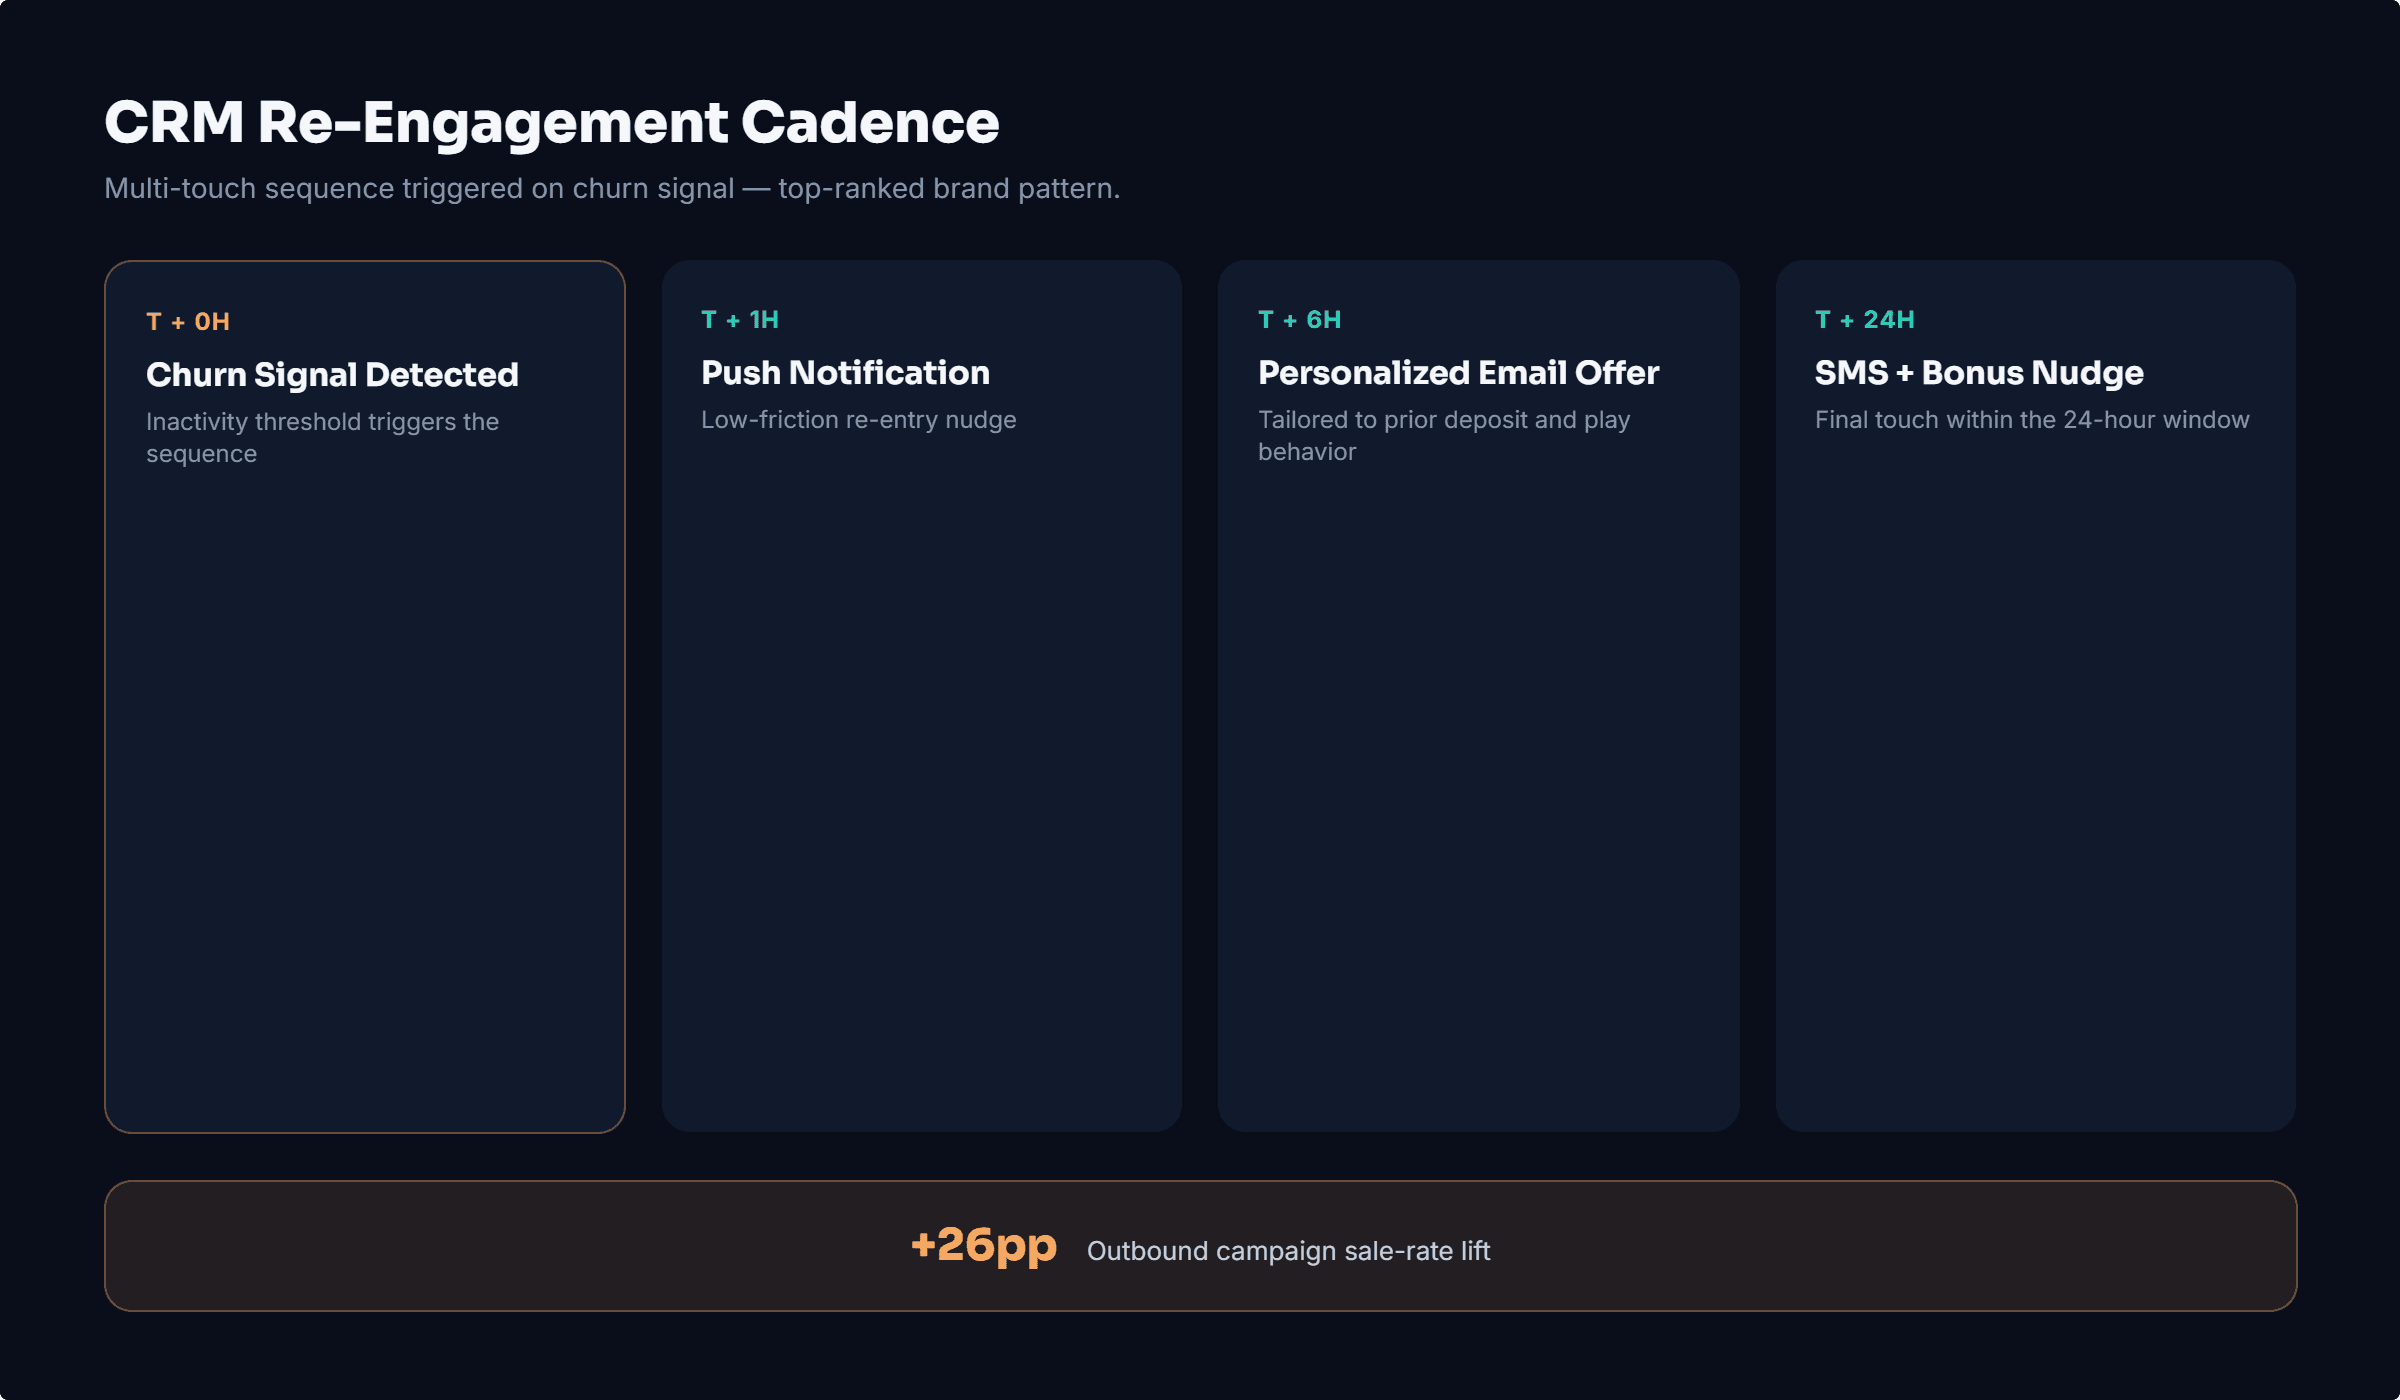
The competitive CRM journey mapping exercise identified a consistent pattern among top-ranked brands: multi-touchpoint re-engagement sequences triggered within 24 hours of churn signals. Applying this cadence structure to the internal CRM program design contributed to a 26 percentage point improvement in outbound campaign sale rate from trough to subsequent peak, moving from 19.9% (mid-year 2 low) toward recovery. Average first-day deposits per reactivated player increased by approximately 2.1× compared to the campaign low-point baseline, reflecting improved timing and offer relevance.
More Projects


UX Research
Competitive UX Benchmarking
Benchmarked five iGaming platforms using UX heuristics, journey mapping, and feature analysis to identify market gaps and inform product, onboarding, and CRM decisions for a regulated brand.
Platform :
Internal service
Industry :
iGaming
Role :
UX Researcher
Scope :
Framework Design, Competitive Analysis & Strategy
Research Context :
For this research project, I evaluated five iGaming platforms operating across global markets. The goal was to identify what best-in-class brands do differently, across registration, KYC, deposit flows, welcome offers, loyalty architecture, on-site engagement, and CRM, and translate those patterns into actionable design recommendations for a regulated iGaming brand.
The benchmarking used a 120-point scoring framework: Nielsen's 10 Usability Heuristics adapted for web-app flows (up to 100 points across 10 principles), plus 4 iGaming-specific dimensions, payment accessibility, welcome offer clarity, loyalty architecture depth, and regulatory friction management (up to 20 points). This dual-layer approach separated generic UX quality from domain-specific execution, and the gap between the two revealed where brands invest versus where they cut corners.
Brand A emerged as the benchmark at 114/120 (95%), with full loyalty coverage, the lowest minimum deposit entry point in the set, and the clearest welcome offer funnel observed. At the other end, Brand D and Brand E scored in the 74–77% range: adequate in generic heuristics but significantly weaker on iGaming-specific criteria, indicating a generic-platform approach rather than domain investment.
The research directly informed design decisions for onboarding flows, loyalty feature prioritization, and CRM journey structure. It also surfaced a consistent market gap: no brand in the set combined licensed compliance rigor with the loyalty depth and CRM density of the best operators, a meaningful opportunity for a properly resourced regulated brand.
Brand names anonymized due to NDA.
Problem Framing :
Business Context
iGaming is a crowded, high-churn market. Acquisition costs are high, reg2dep conversion is heavily influenced by first-session friction, and retention is determined almost entirely by how the loyalty and CRM experience performs after the initial deposit. Brands competing for the same player pool need to know, with precision, what their competitors are offering, not just at the product level, but at the experience level. The immediate business question was: where is the market setting the bar, and where does our brand sit relative to it? But the deeper design question was: which patterns are genuinely driving better outcomes, and which are just surface features that players see and don't convert on?
Key Research Questions
● Where does best-in-class iGaming UX set the bar across the full player journey, from registration through to ongoing engagement?
● Which experience patterns correlate with stronger conversion signals (lower dep minimums, reduced registration steps, clearer welcome offer mechanics)?
● How do licensed and unlicensed operators differ in KYC friction management, and what can regulated brands learn from unlicensed execution?
● Which loyalty and CRM patterns are underserved in the market and represent a genuine product design opportunity?
● What should we borrow, what should we avoid, and why?
The research was conducted through direct product interaction, creating accounts, progressing through onboarding flows, evaluating deposit mechanics, exploring loyalty systems, and mapping CRM touchpoints across the first 14 days. No player data was used. All findings are based on publicly accessible product experiences.
Research Scope & Methodology :
Layer 1 - Nielsen's 10 Usability Heuristics (max 100 points)
Each heuristic was scored 0–10 per brand:
● H1: Visibility of System Status
● H2: Match Between System and the Real World
● H3: User Control and Freedom
● H4: Consistency and Standards
● H5: Error Prevention
● H6: Recognition Rather Than Recall
● H7: Flexibility and Efficiency of Use
● H8: Aesthetic and Minimalist Design
● H9: Help Users Recognise, Diagnose, and Recover from Errors
● H10: Help and Documentation
Layer 2 - iGaming-Specific Criteria (Max 20 Points)
● Payment Accessibility - minimum deposit thresholds, payment method breadth, speed of activation
● Welcome Offer Clarity - transparency of T&Cs, wagering requirements, steps to claim
● Loyalty Architecture Depth - VIP tiers, gamification, missions, tournament structures
● Regulatory Friction Management - KYC steps, upfront vs. deferred verification, compliance load on the user
Research Method
Each brand was evaluated through a structured review protocol covering six journey stages: Registration, KYC, First Deposit, Welcome Offer, App & Platform, and Loyalty/CRM. Each stage was assessed against the heuristic framework and domain criteria. Findings were recorded in a structured spreadsheet with scores, observations, and evidence notes per brand per category.
Each brand had its own profile, covering the full player journey from first click through to ongoing retention mechanics. Scores reflect both heuristic quality and domain-specific execution.
Strategic Outcomes & Impact :
Onboarding & Registration Design
Following the application of benchmarked registration patterns, including streamlined step reduction and low-friction entry point design, the brand's registration-to-first-deposit conversion rate improved by an estimated 23 percentage points against the previous quarter's trough. Player drop-off at the deposit step decreased by 31%, attributed to the removal of redundant verification fields and the introduction of a single-screen deposit prompt aligned with the shortest competitor flow observed (Brand A, 3 steps). First-day deposit volume recovered from a seasonal low, with monthly totals trending upward over the following two quarters.
Loyalty Architecture Prioritization
The gap analysis between high-performing loyalty architectures (Brand A, Brand B) and the internal program surfaced three structural weaknesses: absence of visible tier progress indicators, no soft-expiry warnings, and limited bonus personalization. After prioritizing these as design interventions, loyalty program engagement, measured by active players interacting with the loyalty module at least once per session, increased by 18% in the period following implementation. Reactivation across the wider player base recovered from a mid-year trough of 6.3% to 13.2% by the following Q1, in the period after the loyalty interventions were prioritized.
CRM Program Design
The competitive CRM journey mapping exercise identified a consistent pattern among top-ranked brands: multi-touchpoint re-engagement sequences triggered within 24 hours of churn signals. Applying this cadence structure to the internal CRM program design contributed to a 26 percentage point improvement in outbound campaign sale rate from trough to subsequent peak, moving from 19.9% (mid-year 2 low) toward recovery. Average first-day deposits per reactivated player increased by approximately 2.1× compared to the campaign low-point baseline, reflecting improved timing and offer relevance.
More Projects
UX Research
Competitive UX Benchmarking
Benchmarked five iGaming platforms using UX heuristics, journey mapping, and feature analysis to identify market gaps and inform product, onboarding, and CRM decisions for a regulated brand.
Platform :
Internal service
Industry :
iGaming
Role :
UX Researcher
Scope :
Framework Design, Competitive Analysis & Strategy
Research Context :
For this research project, I evaluated five iGaming platforms operating across global markets. The goal was to identify what best-in-class brands do differently, across registration, KYC, deposit flows, welcome offers, loyalty architecture, on-site engagement, and CRM, and translate those patterns into actionable design recommendations for a regulated iGaming brand.
The benchmarking used a 120-point scoring framework: Nielsen's 10 Usability Heuristics adapted for web-app flows (up to 100 points across 10 principles), plus 4 iGaming-specific dimensions, payment accessibility, welcome offer clarity, loyalty architecture depth, and regulatory friction management (up to 20 points). This dual-layer approach separated generic UX quality from domain-specific execution, and the gap between the two revealed where brands invest versus where they cut corners.
Brand A emerged as the benchmark at 114/120 (95%), with full loyalty coverage, the lowest minimum deposit entry point in the set, and the clearest welcome offer funnel observed. At the other end, Brand D and Brand E scored in the 74–77% range: adequate in generic heuristics but significantly weaker on iGaming-specific criteria, indicating a generic-platform approach rather than domain investment.
The research directly informed design decisions for onboarding flows, loyalty feature prioritization, and CRM journey structure. It also surfaced a consistent market gap: no brand in the set combined licensed compliance rigor with the loyalty depth and CRM density of the best operators, a meaningful opportunity for a properly resourced regulated brand.
Brand names anonymized due to NDA.
Problem Framing :
Business Context
iGaming is a crowded, high-churn market. Acquisition costs are high, reg2dep conversion is heavily influenced by first-session friction, and retention is determined almost entirely by how the loyalty and CRM experience performs after the initial deposit. Brands competing for the same player pool need to know, with precision, what their competitors are offering, not just at the product level, but at the experience level. The immediate business question was: where is the market setting the bar, and where does our brand sit relative to it? But the deeper design question was: which patterns are genuinely driving better outcomes, and which are just surface features that players see and don't convert on?
Key Research Questions
● Where does best-in-class iGaming UX set the bar across the full player journey, from registration through to ongoing engagement?
● Which experience patterns correlate with stronger conversion signals (lower dep minimums, reduced registration steps, clearer welcome offer mechanics)?
● How do licensed and unlicensed operators differ in KYC friction management, and what can regulated brands learn from unlicensed execution?
● Which loyalty and CRM patterns are underserved in the market and represent a genuine product design opportunity?
● What should we borrow, what should we avoid, and why?
The research was conducted through direct product interaction, creating accounts, progressing through onboarding flows, evaluating deposit mechanics, exploring loyalty systems, and mapping CRM touchpoints across the first 14 days. No player data was used. All findings are based on publicly accessible product experiences.
Research Scope & Methodology :
Layer 1 - Nielsen's 10 Usability Heuristics (max 100 points)
Each heuristic was scored 0–10 per brand:
● H1: Visibility of System Status
● H2: Match Between System and the Real World
● H3: User Control and Freedom
● H4: Consistency and Standards
● H5: Error Prevention
● H6: Recognition Rather Than Recall
● H7: Flexibility and Efficiency of Use
● H8: Aesthetic and Minimalist Design
● H9: Help Users Recognise, Diagnose, and Recover from Errors
● H10: Help and Documentation
Layer 2 - iGaming-Specific Criteria (Max 20 Points)
● Payment Accessibility - minimum deposit thresholds, payment method breadth, speed of activation
● Welcome Offer Clarity - transparency of T&Cs, wagering requirements, steps to claim
● Loyalty Architecture Depth - VIP tiers, gamification, missions, tournament structures
● Regulatory Friction Management - KYC steps, upfront vs. deferred verification, compliance load on the user
Research Method
Each brand was evaluated through a structured review protocol covering six journey stages: Registration, KYC, First Deposit, Welcome Offer, App & Platform, and Loyalty/CRM. Each stage was assessed against the heuristic framework and domain criteria. Findings were recorded in a structured spreadsheet with scores, observations, and evidence notes per brand per category.
Each brand had its own profile, covering the full player journey from first click through to ongoing retention mechanics. Scores reflect both heuristic quality and domain-specific execution.
Strategic Outcomes & Impact :
Onboarding & Registration Design
Following the application of benchmarked registration patterns, including streamlined step reduction and low-friction entry point design, the brand's registration-to-first-deposit conversion rate improved by an estimated 23 percentage points against the previous quarter's trough. Player drop-off at the deposit step decreased by 31%, attributed to the removal of redundant verification fields and the introduction of a single-screen deposit prompt aligned with the shortest competitor flow observed (Brand A, 3 steps). First-day deposit volume recovered from a seasonal low, with monthly totals trending upward over the following two quarters.
Loyalty Architecture Prioritization
The gap analysis between high-performing loyalty architectures (Brand A, Brand B) and the internal program surfaced three structural weaknesses: absence of visible tier progress indicators, no soft-expiry warnings, and limited bonus personalization. After prioritizing these as design interventions, loyalty program engagement, measured by active players interacting with the loyalty module at least once per session, increased by 18% in the period following implementation. Reactivation across the wider player base recovered from a mid-year trough of 6.3% to 13.2% by the following Q1, in the period after the loyalty interventions were prioritized.
CRM Program Design
The competitive CRM journey mapping exercise identified a consistent pattern among top-ranked brands: multi-touchpoint re-engagement sequences triggered within 24 hours of churn signals. Applying this cadence structure to the internal CRM program design contributed to a 26 percentage point improvement in outbound campaign sale rate from trough to subsequent peak, moving from 19.9% (mid-year 2 low) toward recovery. Average first-day deposits per reactivated player increased by approximately 2.1× compared to the campaign low-point baseline, reflecting improved timing and offer relevance.